Delta Flows Network

Program Overview

The Delta Flows Network began as an experiment to test new hydroacoustic technology in a tidally-influenced region. Two ultrasonic velocity meters (UVMs) were installed in 1987 at Old and Middle Rivers. The technology proved to be reliable and the network expanded through the 1990’s to a total of 12 stations. In the early 2000's new acoustic Doppler velocity meter (ADVM) technology was implemented throughout the network and additional stations in the North and Central Delta were installed as gaps in data acquisition efforts were identified. In 2010, data collection efforts at many stations were expanded to include water quality.

Today the USGS Hydrodynamics Group operates over 30 long-term flow stations; water quality data are collected at many of the stations either by the Hydrodynamics Group or as part of collaborative efforts with other agencies and USGS scientists. These data are collected every 15 minutes and are telemetered and made available to the public in near real-time.

Data from this network of stations are used by Delta managers and scientists to make real-time operational decisions. In addition, these data are used to calibrate and validate numerical models that are used to predict water levels, flow speeds, and spatial and temporal evolution of salinity in the Delta. The data also play a significant role in interdisciplinary investigations and will be the foundation for large-scale adaptive management experiments in the future.

Map showing locations throughout the delta of core Delta Flow Network Stations, the State Water Project pumping plant, and the Central Valley Project pumping plant. Inset map shows the location of the delta area in California. Link opens image in new window.
Map of Long Term USGS Flow Stations. USGS image.
(click to enlarge in new window)

Methods

The techniques and methods used by this project are well-documented. Below are links to a variety of resources outlining USGS protocols for field and data acquisition relevant to this project.

Relevant Reports

Related Information

Principal Investigator

Catherine Ruhl, cruhl@usgs.gov
U.S. Geological Survey

Looking for Data?

All data are available through USGS NWIS-Web.

Platform of monitoring instruments supported by three poles above the water at Cache Slough above Ryer Island Ferry
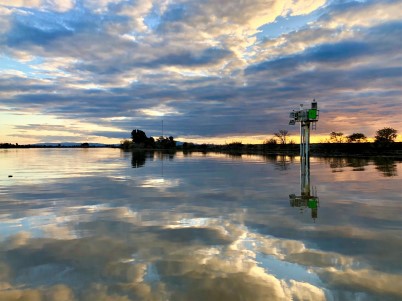
USGS Flow and Water Quality Monitoring Station 11455385, Cache Slough above Ryer Island Ferry.
USGS photo by Joseph Hatfield