Program Overview
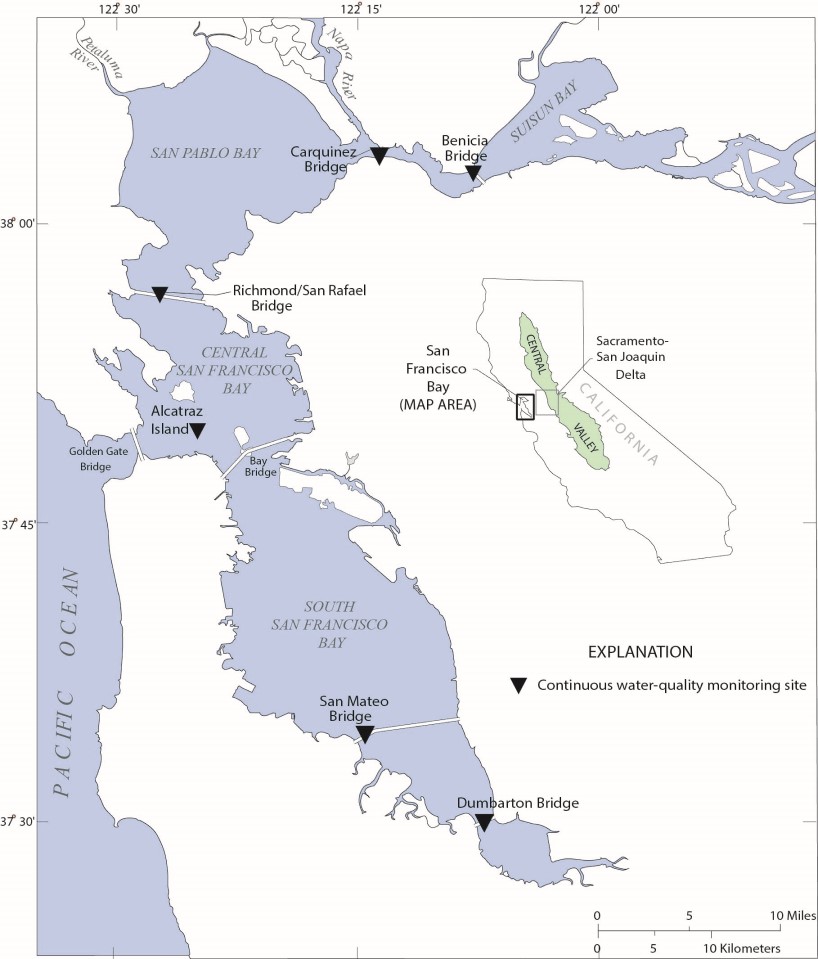 Map of salinity and temperature stations in San Francisco Bay. (click to open in new tab)
This study collects data to observe the spatial and temporal variability of temperature and salinity throughout the estuary. Data are collected every 15 minutes at six sites located throughout the estuary; in most cases, sites have sensors at two depths to observe vertical variations. Beginning in 1989, this study provides long-term, high-quality data that allows for identification of water-quality trends and improves our understanding of water quality and transport processes in the estuary.
Publications
Looking for Data?
For other data needs, contact Pat Orlando, porlando@usgs.gov, U.S. Geological Survey
Principal Investigator
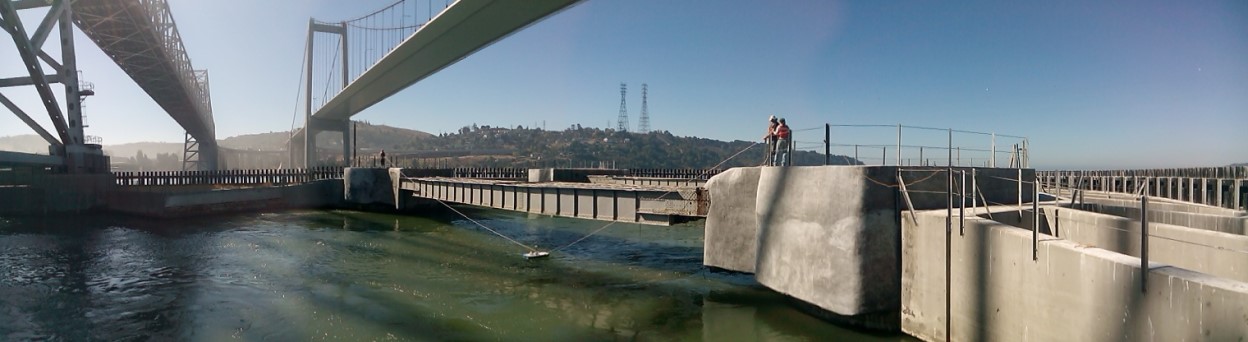 I-80/Carquinez Bridge across Carquinez Strait. USGS image by Paul A. Work.