Program Overview
The San Francisco Bay Study (Bay Study) was established in 1980 to determine the effects of freshwater outflow on the abundance and distribution of fish and mobile crustaceans in the San Francisco Estuary, primarily downstream of the Sacramento-San Joaquin Delta.
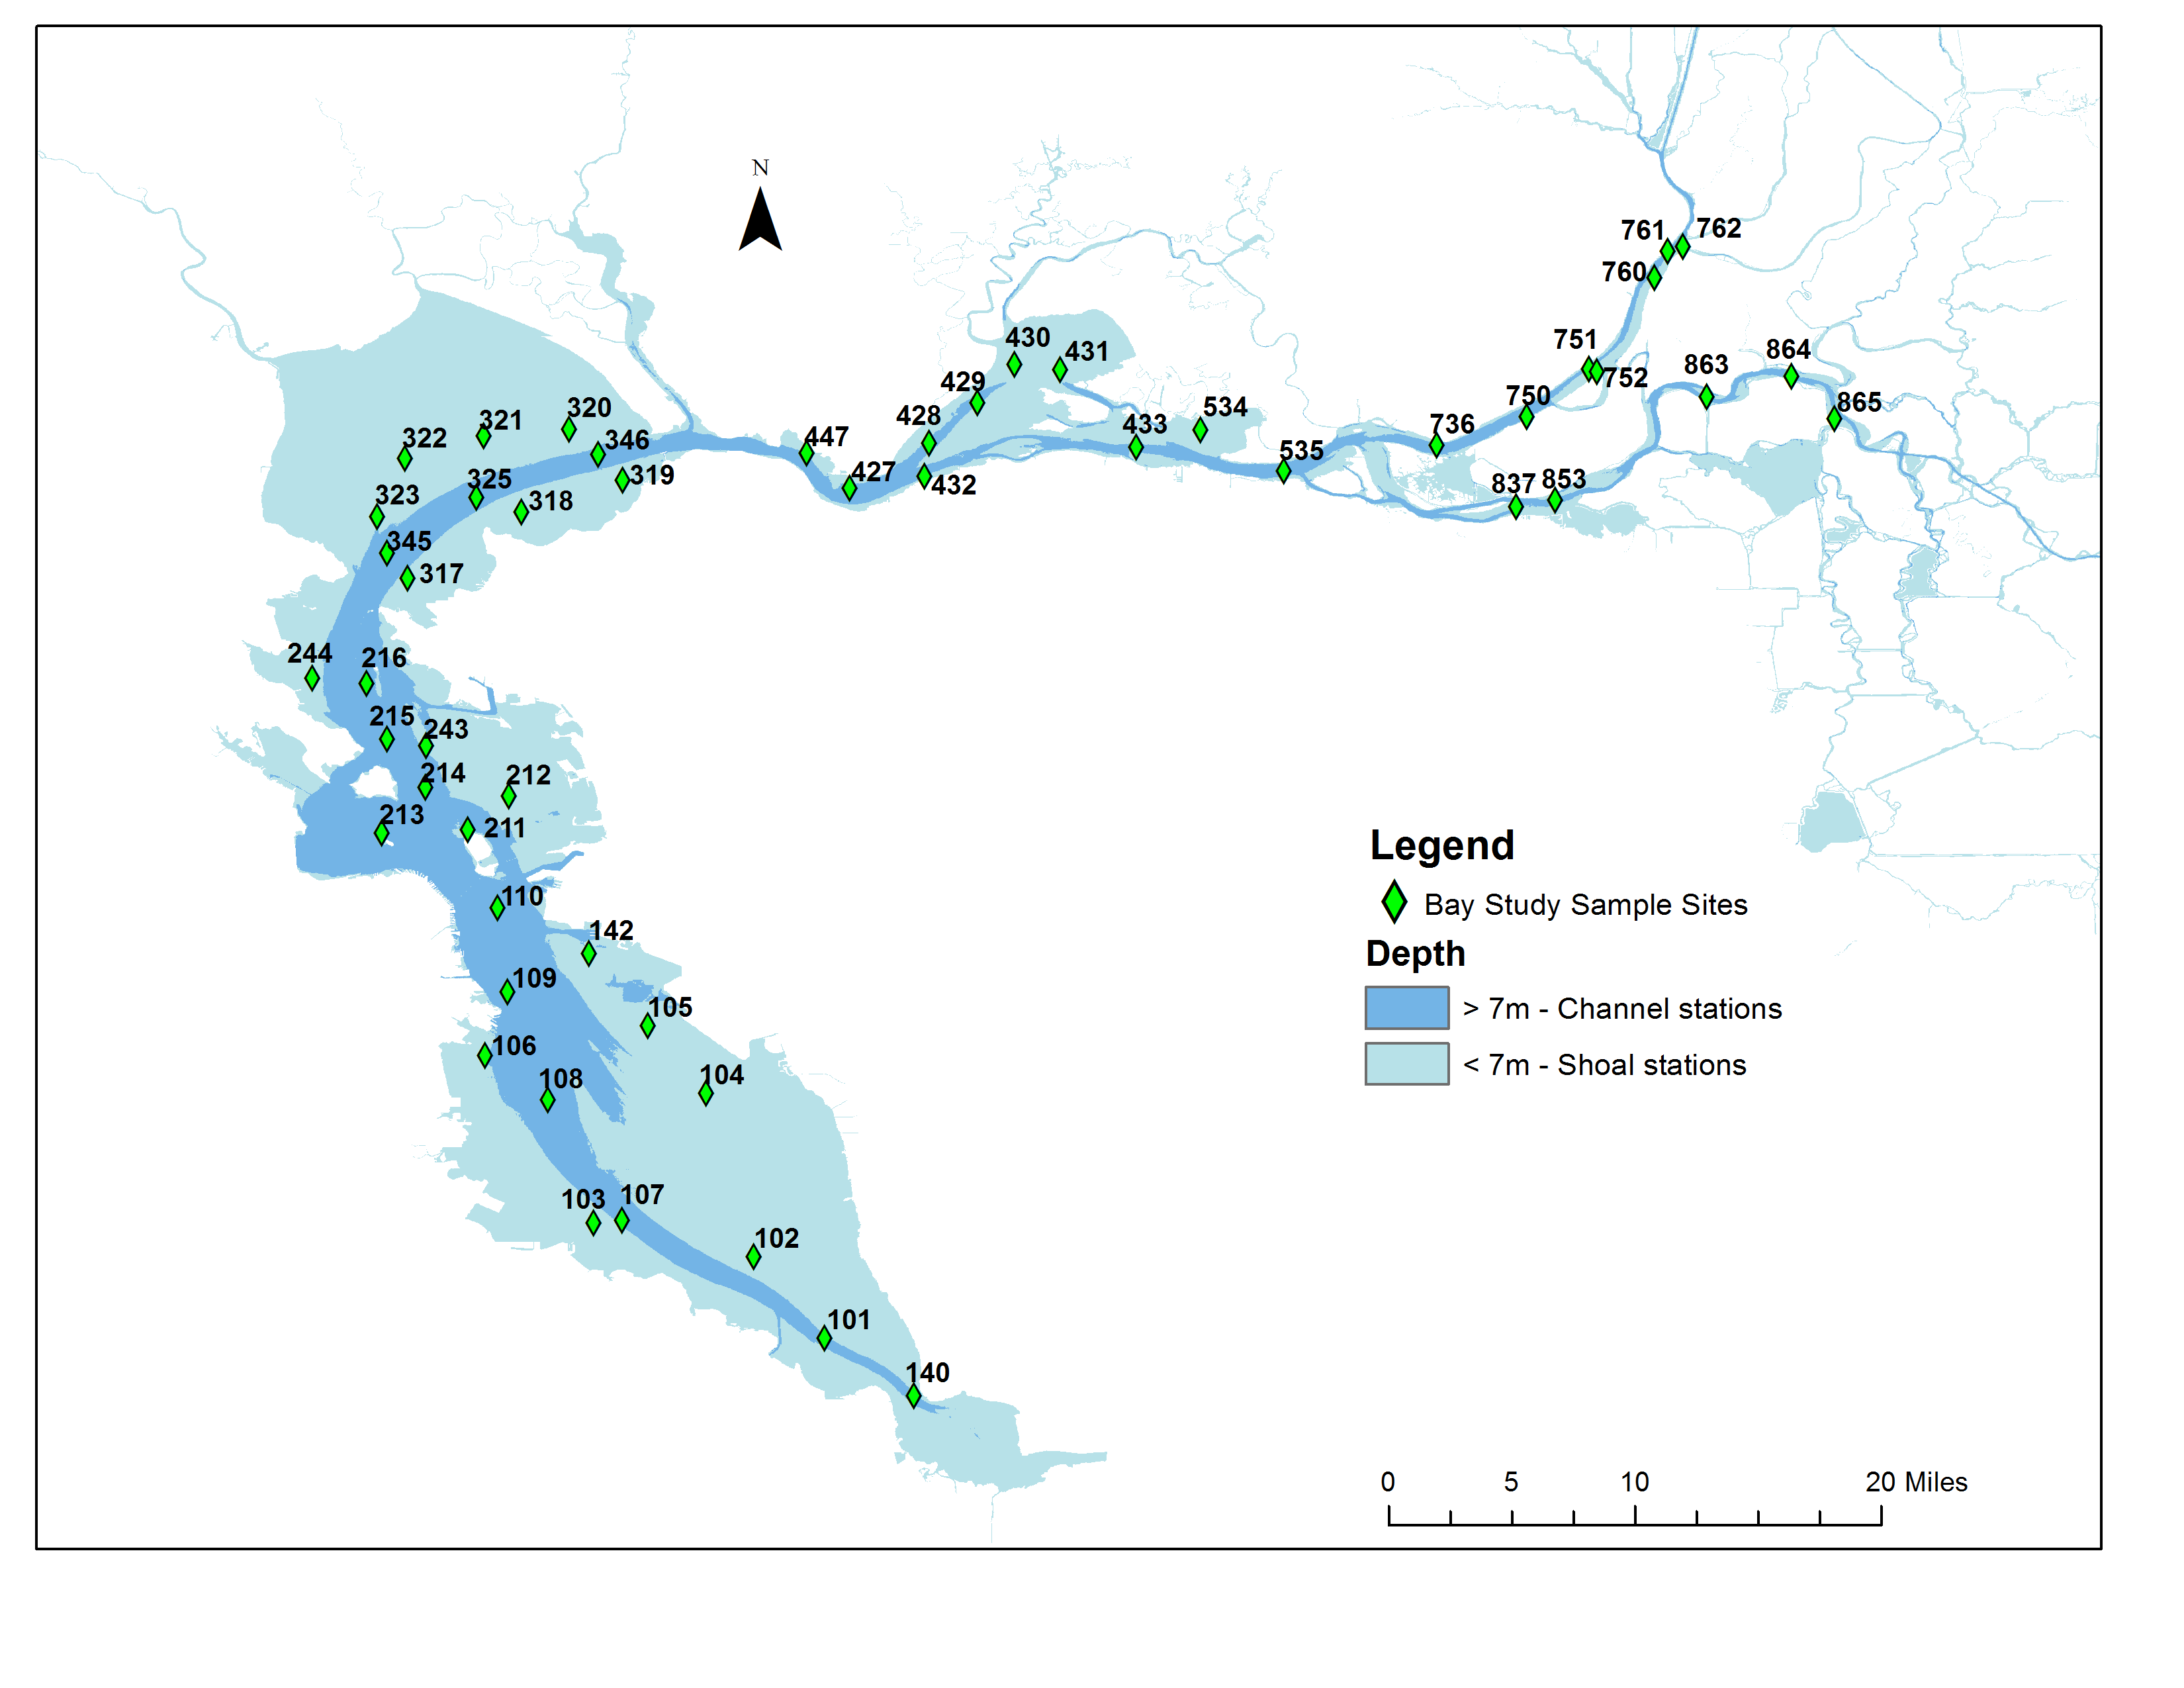
Sampling ranges from south of the Dumbarton Bridge in South San Francisco Bay, to just west of Alcatraz Island in Central San Francisco Bay, throughout San Pablo and Suisun bays, north to the confluence Steamboat and Cache sloughs on the Sacramento River, and east to Old River Flats on the San Joaquin River. The open water or boat survey samples 52 stations monthly: 35 original stations, 7 stations added in 1988, 4 stations added in 1991, and 6 stations added in 1994.
History
- January 1980 Start of the San Francisco Bay Study open water survey with monthly sampling using 3 nets
- July 1980 Start of the beach seine survey
- May 1982 Start of the shore-based ringnet survey for crabs
- January 1987 Discontinued the beach seine survey
- July 1989 Discontinued plankton net as part of open water survey
- December 1994 Discontinued the ringnet survey
Methods
The Bay Study uses a 42-foot stern trawler to sample with 2 trawl nets at each open water station. The otter trawl, which samples demersal fishes, shrimp, and crabs, is towed against the current at a standard engine rpm for 5 minutes then retrieved. The midwater trawl, which samples pelagic fishes, is towed with the current at a standard engine rpm for 12 minutes and retrieved obliquely such that all depths are sampled equally. The MWT does not fish deeper than 35'-40', so the entire water column is not sampled at the deepest channel stations. The open water survey included a plankton net that sampled larval fish and crustaceans, but this was discontinued in 1989.

Map of the San Francisco Bay Study sampling locations. CDFW image.
(click to enlarge in new window)
Fish, caridean shrimp, and brachyuran crabs are identified, measured, and counted. Shrimp and crabs are also sexed. Sampling effort is quantified (i.e. distance towed, volume of water filtered) and salinity, water temperature, Secchi depth, and station depth are measured; wave height, tide, cloud cover, and tow direction relative to the current are categorized. The length, catch, and effort data is used to calculate catch-per-unit-effort (CPUE) by species and age class. The CPUE data is used to calculate monthly and annual abundance indices, which are used to track seasonal and annual population trends, and for distributional analyses. Important factors that control or regulate abundance and distribution of fish and crustaceans in the estuary include salinity, temperature, freshwater outflow, ocean temperature, upwelling, and surface currents, primary and secondary productivity, and introduced species. We are interested in how species respond to changes in the physical environment on several temporal scales – seasonal, annual, decadal, and longer.
Relevant Publications
The San Francisco Bay Study produces several annual Status and Trends reports that summarize abundance trends and distribution for 40+ species, which includes most commonly collected species and species of interest, such as special-status species. These reports are published in the IEP Newsletter. Previous IEP Newsletters can be found in the IEP Library. The 1999 IEP Technical Report, “Report on the 1980-1995 Fish, Shrimp, and Crab Sampling in the San Francisco Estuary, California”, is a good source of basic information. This technical report is out-of-print, but a PDF copy is available upon request. Send email to iep@wildlife.ca.gov.
Bibliography
- Brown, T. and K. Hieb 2006. Poster: Introduction of the Siberian prawn Exopalaemon modestus to the Sacramento-San Joaquin Delta (PDF), 2006 CALFED Bay-Delta Program Science Conference, Sacramento, CA. California Department of Fish and Game (186 KB)
- Giannetta, J., J. Bautista, K. Hieb and A. Raisch 2015. Poster: “The Blob” Brings Subtropical Visitors to the San Francisco Estuary (PDF), 2015 State of the Estuary conference, Oakland, CA.. California Department of Fish and Wildlife (231 KB)
- Hieb, K. 2020. San Francisco Bay Study Station Map (PDF), California Department of Fish and Wildlife (90.7 KB)
- Hieb, K. 2020. San Francisco Bay Study Station Coordinates (PDF), California Department of Fish and Wildlife (184 KB)
- Messineo, J. and D. Contreras 2009. Poster: Midwater Trawl Net Mouth Measurement (PDF), 2009 State of the Estuary conference. California Department of Fish and Game (303 KB)
Related Information